Overview
This page is for anyone who has access to view evaluation results for classes taught by other instructors. This commonly includes roles of department chair, dean, program or course coordinator, etc.
These instructions will describe six different “use cases” or common needs for retrieving and using the course evaluation results of multiple classes.
- Retrieve concise, complete reports for one class at a time
- Efficiently retrieve results for a grouping of classes (e.g., for all courses by a single instructor or within a department)
- A formatted report for each selected class
- An Excel spreadsheet of quantitative (presented for each class and a summary for all classes)
- Overall mean and distribution results for an aggregated group of classes
- An instructor results summary of formatted for annual performance or P&T Reviews
- Monitor response rates for individual classes, a department or a college
- Obtain a list of questions used for your class or area
The courses you can view are determined by your unique access restrictions. If you are unable to access courses that should be available to you, please let us know by contacting the Registrar's Office at [email protected].
REPORTS MENU
Whereas the instructor usually accesses their own class results from the Home menu, administrators will use one of the Reports menu items.
- Status Tracking – used to find the real time response rates for individual classes or classes within a department or college.
- Report Browser – allows you to set various filters to list classes of interest, then view various reports of the individual classes.
- Rollup Reports – allow you to set filters that will define a set of classes whose results will be aggregated or compared.
- Instructor Analysis – displays an instructor’s results over time compared to the department’s aggregate results. WebOptics shows both an overall summary for each course as well as results for each individual evaluation form question over time.
- Instructor Summary – Provides a summary of an instructor’s evaluations across courses and within a selected time period.
Use Case #2: Retrieve results for a grouping of classes
- Complete results in a formatted report for each selected class
- Quantitative or All results in Excel spreadsheets (presented for each class and a summary for all classes)
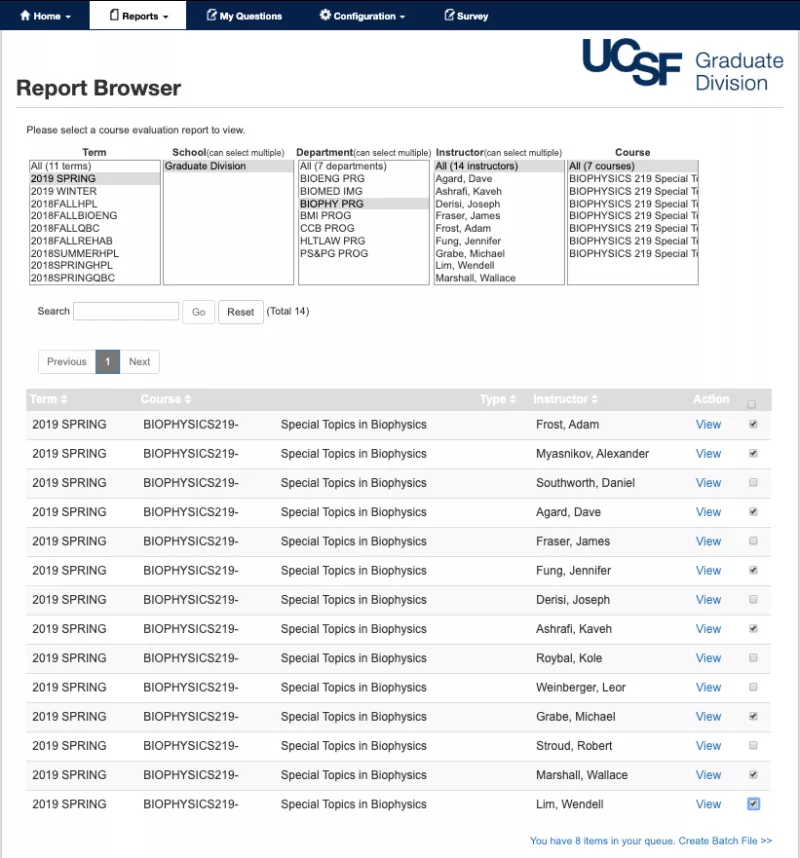
After narrowing your list of classes within the Report Browser, you may select a batch of classes to output reports. Click on the boxes to select the classes you wish to include.
As you select classes, the bottom right corner will record the number of items in your batch.
After selecting the desired classes, click the ‘Create Batch File’ link at the bottom of the screen.
Next your selected list appears with options to select the ‘Output Type’ and ‘Reports’.
| Output Type | Reports | Report Needs |
|---|---|---|
| An Excel File | Quantitative or All Responses | Quantitative results in Excel for a group of classes Produce one excel File with quantitative results or all (qualitative and quantitative) for multiple classes (one Excel worksheet per class, plus one summary worksheet) |
Use Case #3: Overall mean and distribution results for an aggregated group of classes
While Report Browser specializes in separate, singular class reports, the Rollup Reports focuses on mean data for aggregated groups of classes. Rollup Reports only report on quantitative questions. However, the rollup capability greatly expands your ability to analyze trends and comparisons. Here are some examples of ways you might use Rollup Reports:
| Example Aggregation | Sample Uses |
|---|---|
| Rollup all class sections into a course | Course Coordinator may wish to compare how different sections performed. |
| Rollup all class sections taught by a single instructor | Department Chair could calculate an average evaluation score for each instructor. |
| Rollup all lab sections for 100 level courses in a department | Dept. Lab Manager is able to determine if there are problematic issues across all labs. |
| Compare small, medium and large sized courses | Program Director is able to see if class size is detrimental to student satisfaction with a class. |
| Compare online vs face to face classes across a department (if applicable) | Program Director can check that online sections are roughly equivalent to in person sections. |
How to Create a Rollup Report
There are three main sections to set up to run a rollup report: Drill Down, Filter, and Questions & Reports.
Drill Down
These set the academic organizational context to view
Form—Use “Full Form” for all classes, except “Internship” classes
Term—Select one term or “All Terms”
Session—Select one term or “All Sessions” within the term
School—Select one School or “All Schools”
Department, Instructor, Subject, Number—Optional to further narrow down classes to include
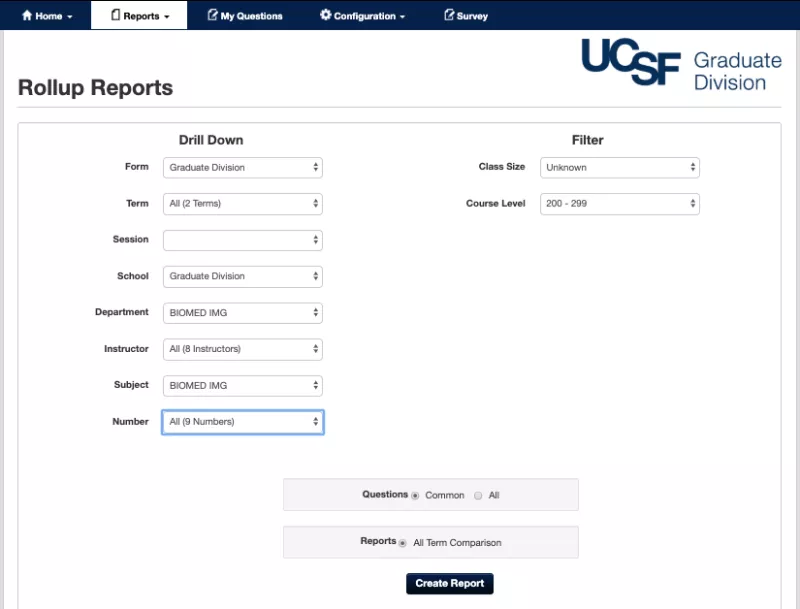
Filter (optional)
These allow you to control which classes to include in the statistics by selecting certain course characteristics. You may set multiple filters; more filters will reduce the number of classes included. For example, you could set filters to include only undergraduate lecture courses taught online using ‘Level’, ‘Instruction Mode’ and ‘Type’. Or you could include only small 200 level classes with a service-learning component using ‘Class Size’, ‘Course Level’, and ‘Service Learning’.
Questions & Reports
You will need to experiment with these to familiarize yourself with the different outputs. After changing a setting, press “Create Report” to see the actual results.
Questions—Different classes, with different class characteristics, will often have different sets of questions asked. Thus, when you combine various classes you may choose to view results for only ‘Common’ questions shared by the selected classes, or to view ‘All’ question results. If you choose ‘All’ check the button.
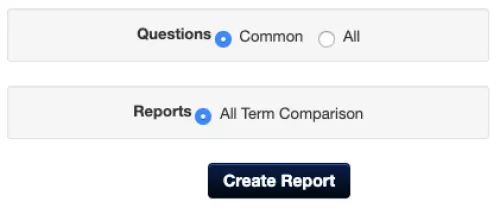
Reports—Allows viewing one total result, or comparative results. See examples below.
- ‘Rollup’ refers to simple aggregation. For each question, the system combines all responses from all classes into one single result.
- ‘Comparison’ will calculate a result for each category, and display the compared means graphically. After choosing ‘Comparison’, you will be prompted to select which characteristic to use for comparison. For example, if Size was selected, it would present the means for Small, Medium, and Large classes.
Examples of the Rollup and Comparison report options are shown below. A summary of the filters is provided above each graph.
Rollup Report Example
One term and course was selected under ‘Drill Down’. Reports set to ‘Rollup’.
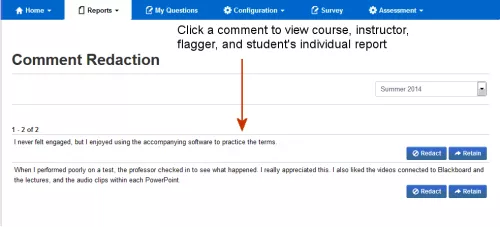
How to review flagged comments
Administrators, with the proper permissions can perform the following tasks to review a flagged comment.
- Choose “Comment Redaction” from the Reports menu.
- Select the appropriate term from the drop-down box. The report displays flagged comments
-
- To the right of each report question for review is a Redact button and a Retain button. The reviewer can examine each comment and decide what to do.
- To remove the comment from the evaluation, click the “Redact” button. Enter a comment about the redaction in the text field. A reason why this comment should be redacted must be entered in order to continue.
- Click the comment’s “Redact” button. To alter the decision and keep the comment, select the drop-down and click “Retain.” To edit the reason for the redaction, select the drop-down and click “Edit Review Comment.”
- To keep the comment in the evaluation, click the “Retain” button.Enter a comment about the retention in the text field. Entering a comment in this field is optional.
- Click the comment’s “Retain” button. To Redact the decision and delete the comment, select the drop-down and click “Retain.”
Note: To edit the reason for the retention, select the drop-down and click “Edit Review Comment.”