Demographics and Degree Outcomes
Expand to view definitions
A First Generation to College student is an individual whose parents or legal guardians did not attend a four-year college or university.
A First Generation to Graduate student is an individual whose parents or legal guardians did not complete a four-year degree.
Expand to view Demographics and Outcomes data in tabular form
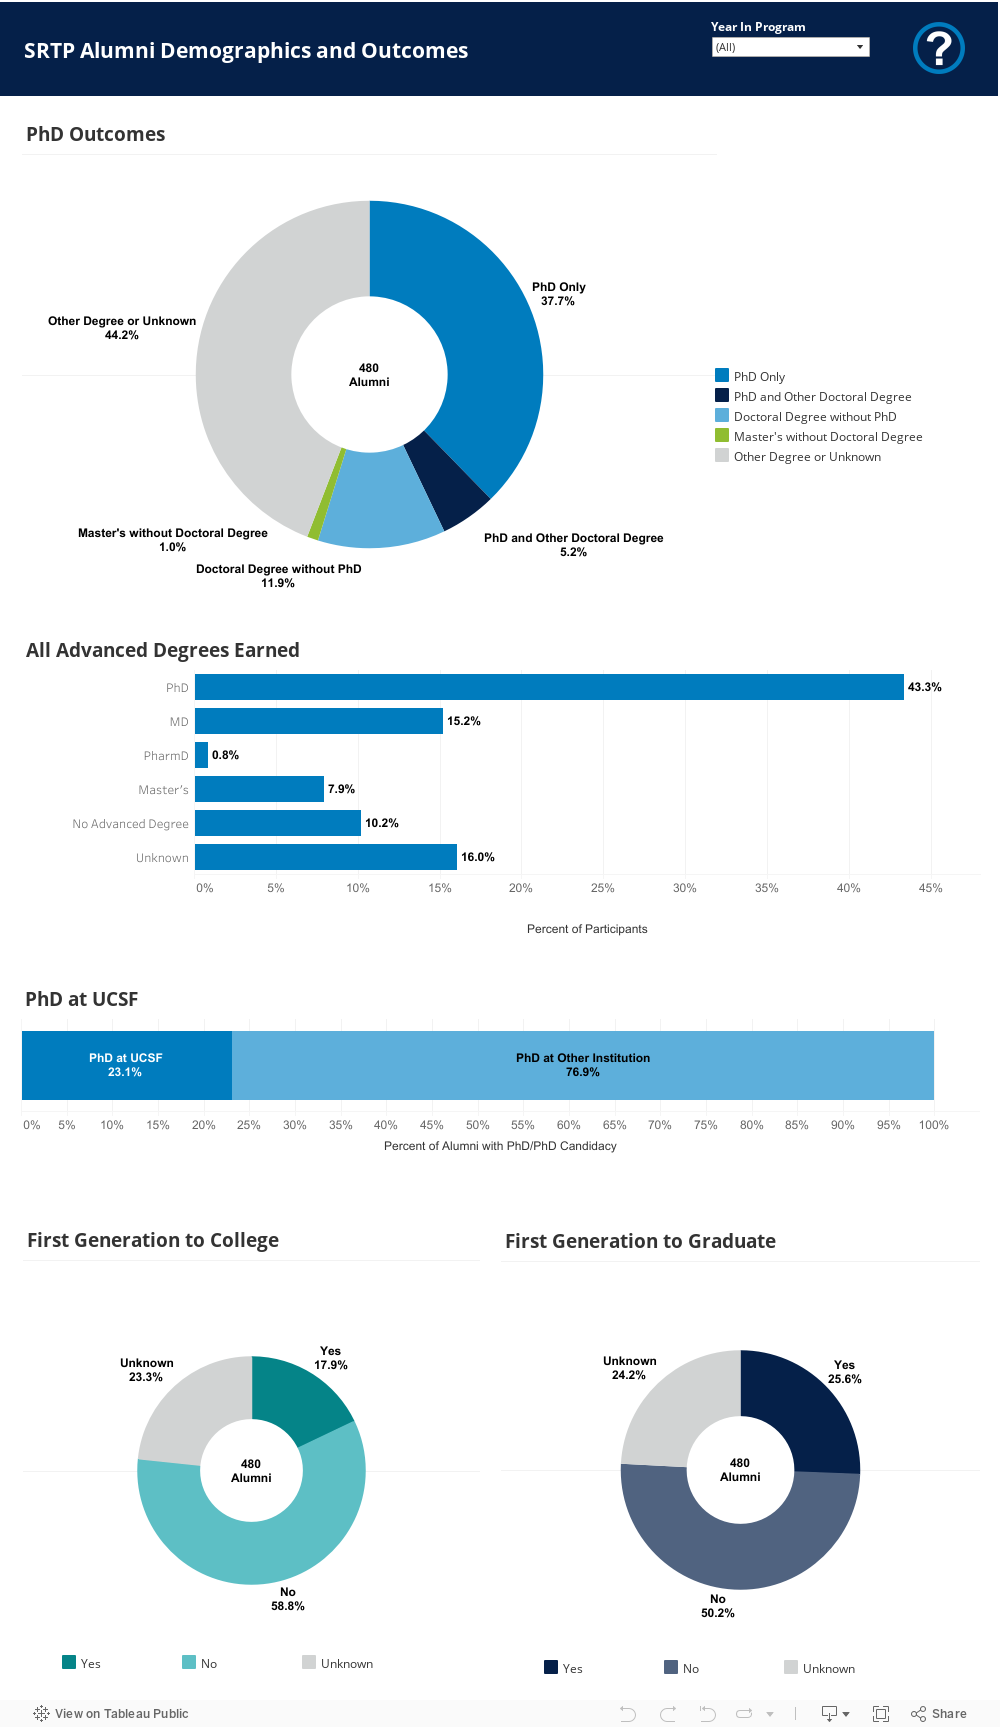
SRTP Alumni Demographics and Outcomes
PhD Outcomes
| Year in Program | PhD Only | PhD and Other Doctoral Degree | Doctoral Degree without PhD | Master's without Doctoral Degree | Other Degree or Unknown |
|---|---|---|---|---|---|
| All | 37.7% (181) | 5.2% (25) | 11.9% (57) | 1.0% (5) | 44.2% (212) |
| 2011 | 36.2% (21) | 5.2% (3) | 24.1% (14) | 1.7% (1) | 32.8% (19) |
| 2012 | 40.0% (22) | 3.6% (2) | 18.2% (10) | 0.0% (0) | 38.2% (21) |
| 2013 | 48.9% (23) | 4.3% (2) | 8.5% (4) | 0.0% (0) | 38.3% (18) |
| 2014 | 50.0% (29) | 6.9% (4) | 5.2% (3) | 3.4% (2) | 34.5% (20) |
| 2015 | 32.7% (16) | 4.1% (2) | 26.5% (13) | 0.0% (0) | 36.7% (18) |
| 2016 | 43.9% (25) | 7.0% (4) | 14.0% (8) | 3.5% (2) | 31.6% (18) |
| 2017 | 38.0% (19) | 12.0% (6) | 8.0% (4) | 0.0% (0) | 42.0% (21) |
| 2018 | 50.0% (26) | 3.8% (2) | 1.9% (1) | 0.0% (0) | 44.2% (23) |
| 2019 | 0.0% (0) | 0.0% (0) | 0.0% (0) | 0.0% (0) | 100% (54) |
All Advanced Degrees
| Year in Program | PhD | MD | PharmD | Master's | No Advanced Degree | Unknown |
|---|---|---|---|---|---|---|
| All | 43.3% | 15.2% | 0.8% | 7.9% | 10.2% | 16.0% |
| 2011 | 41.4% | 27.6% | 0.0% | 8.6% | 13.8% | 17.2% |
| 2012 | 45.5% | 18.2% | 0.0% | 12.7% | 3.6% | 21.8% |
| 2013 | 55.3% | 12.8% | 0.0% | 0.0% | 2.1% | 31.9% |
| 2014 | 56.9% | 12.1% | 0.0% | 10.3% | 8.6% | 17.2% |
| 2015 | 36.7% | 24.5% | 6.1% | 16.3% | 12.2% | 10.2% |
| 2016 | 50.9% | 19.3% | 0.0% | 7.0% | 10.5% | 17.5% |
| 2017 | 50.0% | 16.0% | 2.0% | 6.0% | 22.0% | 16.0% |
| 2018 | 53.8% | 5.8% | 0.0% | 9.6% | 19.2% | 13.5% |
| 2019 | 0.0% (0) | 0.0% (0) | 0.0% (0) | 0.0% (0) | 0.0% (0) | 100% (54) |
PhD at UCSF
| Year in Program | PhD at UCSF | PhD at Other Institution |
|---|---|---|
| All | 23.1% (48) | 76.9% (160) |
| 2011 | 29.2% (7) | 70.8% (17) |
| 2012 | 20.0% (5) | 80.0% (20) |
| 2013 | 23.1% (6) | 76.9% (20) |
| 2014 | 27.3% (9) | 72.7% (24) |
| 2015 | 16.7% (3) | 83.3% (15) |
| 2016 | 41.4% (12) | 58.6% (17) |
| 2017 | 12.0% (3) | 88.8% (22) |
| 2018 | 10.7% (3) | 89.3% (25) |
| 2019 | 0.0% (0) | 0.0% (0) |
First Generation to College
| Year in Program | Yes | No | Unknown |
|---|---|---|---|
| All | 17.9% (86) | 58.8% (282) | 23.3% (112) |
| 2011 | 19.0% (11) | 50.0% (29) | 31.0% (18) |
| 2012 | 20.0% (11) | 49.1% (27) | 30.9% (17) |
| 2013 | 14.9% (7) | 57.4% (27) | 27.7% (13) |
| 2014 | 19.0% (11) | 48.3% (28) | 32.8% (19) |
| 2015 | 10.2% (5) | 55.1% (27) | 34.7% (17) |
| 2016 | 15.8% (9) | 54.4% (31) | 29.8% (17) |
| 2017 | 20.0% (10) | 80.0% (40) | 0.0% (0) |
| 2018 | 26.9% (14) | 69.2% (36) | 3.8% (2) |
| 2019 | 14.8% (8) | 68.5% (37) | 16.7% (9) |
First Generation to Graduate
| Year in Program | Yes | No | Unknown |
|---|---|---|---|
| All | 25.6% (123) | 50.2% (241) | 24.2% (116) |
| 2011 | 31.0% (18) | 37.9% (22) | 31.0% (18) |
| 2012 | 29.1% (16) | 38.2% (21) | 32.7% (18) |
| 2013 | 17.0% (8) | 55.3% (26) | 27.7% (13) |
| 2014 | 31.0% (18) | 34.5% (20) | 34.5% (20) |
| 2015 | 10.2% (5) | 55.1% (27) | 34.7% (17) |
| 2016 | 21.1% (12) | 49.1% (28) | 29.8% (17) |
| 2017 | 34.0% (17) | 64.0% (32) | 2.0% (1) |
| 2018 | 34.6% (18) | 61.5% (32) | 3.8% (2) |
| 2019 | 20.4% (11) | 61.1% (33) | 18.5% (10) |
Please contact GEPA if you are unable to get the information you need from the dashboard or tables.
Learn more about UCSF's Summer Research Training Program.
UC San Francisco is a member of the Coalition for Next Generation Life Science.